3
gnuplot examples
This section contains some sample plots, including multiplots (known as subplots in Octave) on
page
. Histograms are found on page
3.1
A first plot
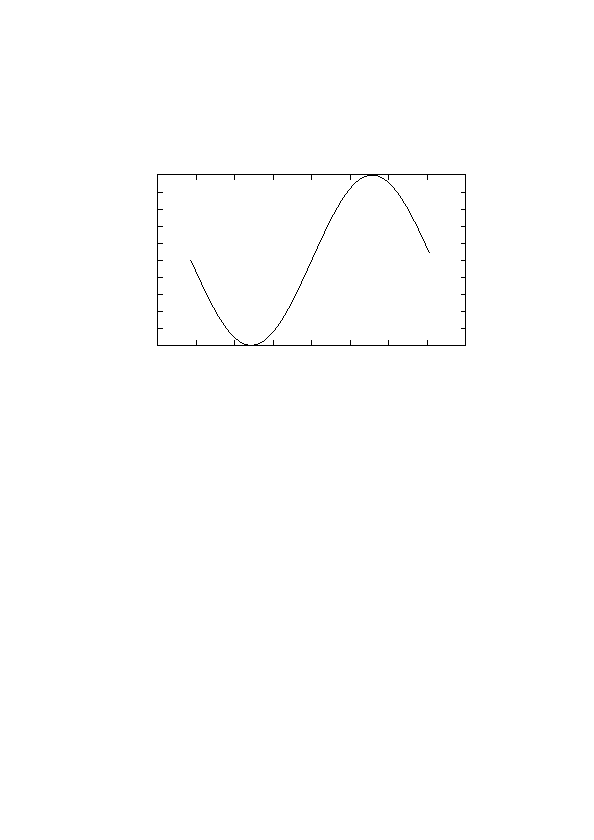
Even though the aim is not to be a gnuplot guide, let’s start with a basic plot.
Plot of sin x for
−π < x < π
-0.8
-0.6
-0.4
-0.2
0
0.2
0.4
0.6
0.8
1
-4
-3
-2
-1
0
1
2
3
4
y
axis
x axis
-1
Figure 1: A sine.
The code for figure
set terminal fig monochrome textspecial
set output "plot/simplesine.fig"
set xlabel "$x$ axis"
set ylabel "$y$ axis"
set title "Plot of $\\sin x$ for $-\\pi < x < \\pi$"
plot "data/simplesine.dat" with lines notitle
It doesn’t look fantastic but is a simple example for first time viewers. First and second line tells
gnuplot to save the plot to the file plot/simplesine.fig. We set the labels on the x and y axis
with command set xlabel "text". Setting a title works similarly. Since we set textspecial
on first line, all text is typeset with L
A
TEX so anything between $ $ will be typeset as formula,
as expected. As mentioned before, commands for L
A
TEX must be double-escaped, ie. use two
backslashes like
\\, since the backslash is an escape-character for gnuplot as well. Then we
instruct to plot the data from the file data/simplesine.dat with lines. We don’t need a key,
or legend, so we write notitle. Easy peasy!
4