3.5
Multiplots
Multiplots, or subplots as known in Octave, is next!
x
2
− x
0
0.2
0.4
0
1
2
3
4
5
6
7
8
x/e
x
-4
-2
0
2
4
6
8
10
12
-2 -1.5 -1 -0.5
0
0.5
1
1.5
2
x
2
(1 + x)
-4
-3
-2
-1
0
1
2
3
4
-3
-2
-1
0
1
2
3
y = sin(x)x
2
− x
-20
0
20
40
60
80
100
120
-10
-5
0
5
10
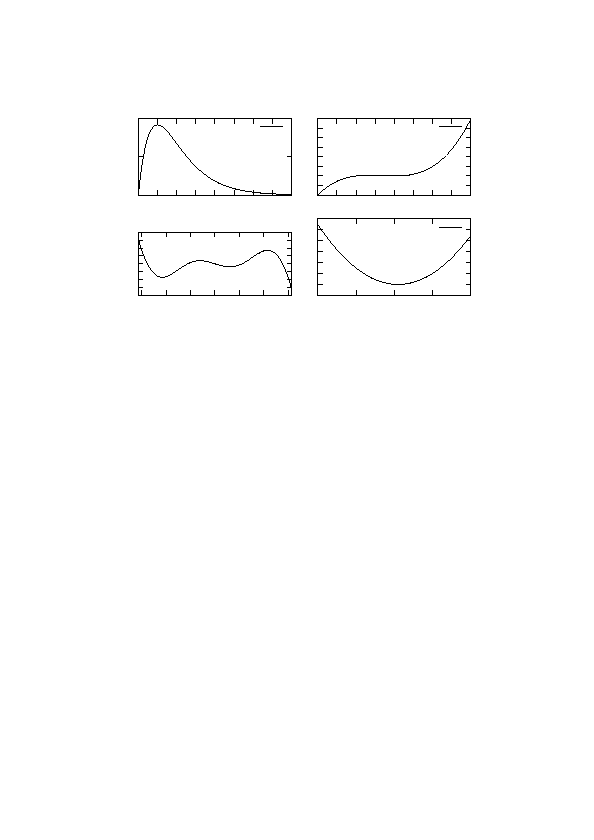
Multiplotting!
Figure 11: Example of multiplots.
The code for figure
set terminal fig monochrome textspecial
set output "plot/multiplot.fig"
# Start multiplot mode with 2 rows, 2 columns.
# They are inserted rowsfirst downwards.
# You can also try columnsfirst and upwards!
set multiplot layout 2,2 rowsfirst downwards title "Multiplotting!"
# Set the left margin so the graphs are lined exact, otherwise they will be
# a little bit tilted due to different ytics:
set lmargin 3
#show margin
set ytics 0,0.2
plot [0:8] x/exp(x) title "$ x / e^x $
set ytics autofreq
# Let gnuplot decide ytics for following plots!
plot [-2:2] x**2*(1+x) title "$ x^2 (1+x) $
set title "$y=\\sin(x) x^2 - x$" # set title for next plot window
plot [-pi:pi] sin(x)*x**2 - x notitle
unset title
# remove title, otherwise remain for following plots
plot x*x-x title "$x^2-x$"
unset multiplot
# Range can be given with [x1:x2], otherwise default range [-10:10].
13