3.3
Various plots
The following are some example figures and the gnuplot code required to produce.
Steps
-0.8
-0.6
-0.4
-0.2
0
0.2
0.4
0.6
0.8
1
0
1
2
3
4
5
6
Here
some
useful
text!
Righ
t
y
lab
el!
This is the x axis
This is plot title: sin(x
− a), where a = 0, 1, ...
Upper x axis label, this is.
Lines
Points
Linespoints
Impulses
-1
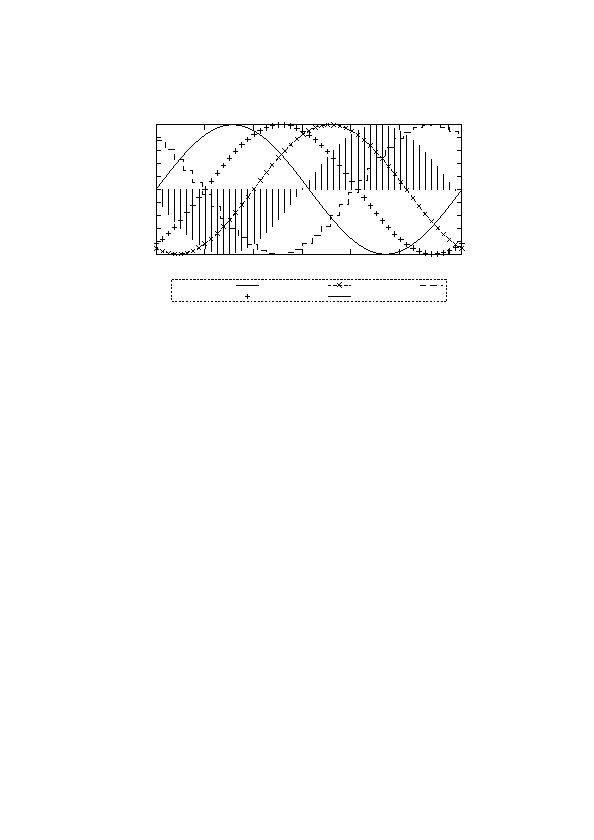
Figure 4: Sines with different styles.
Figure
mainly just shows different line types. Code used is:
set terminal fig monochrome textspecial
set output "plot/sin.fig"
set title "This is plot title: $ \\sin(x-a)$, where $a=0,1,...$"
set xlabel "This is the $x$ axis"
set ylabel "Here some useful text!"
set x2label "Upper $x$ axis label, this is."
set y2label "Right $y$ label!"
# Place legend under graph, horizontal alignment, double spacing between items,
# surround by a box with linestyle 2, increase width of items by 2.5
set key bmargin center horizontal spacing 2 box ls 2 width 2.5
# Fix figure to the last point, ie do not continue to 7.
set autoscale xfixmax
# Plotting every 2nd point from datafile. Select columns with "using", for example
# "using 3:2" to plot column 2 ("y") against column 3 ("x").
plot "data/sin.dat" every 2 using 1:2 title "Lines" with lines linewidth 2, \
"data/sin.dat" every 2 using 1:3 title "Points" with points, \
"data/sin.dat" every 2 using 1:4 title "Linespoints" with linespoints, \
"data/sin.dat" every 2 using 1:5 title "Impulses" with impulses ls 1, \
"data/sin.dat" every 3 using 1:6 title "Steps" with steps
6