y = x
3
0
1
−π
−
π
2
0
π
2
π
sin(x)
8
6
4
2
0
2
4
6
8
8
6
4
2
0
2
4
6
8
P
olar
plot
of
t
and
2
π
for
0
<
t
<
6
/
4
π
2π
t
0
0.5
1
0
2
4
6
8
10
sqrt(x) / int(x+1)
-8
-6
-4
-2
0
2
4
6
8
-2
-1.5
-1
-0.5
0
0.5
1
1.5
2
y = x
2
-1
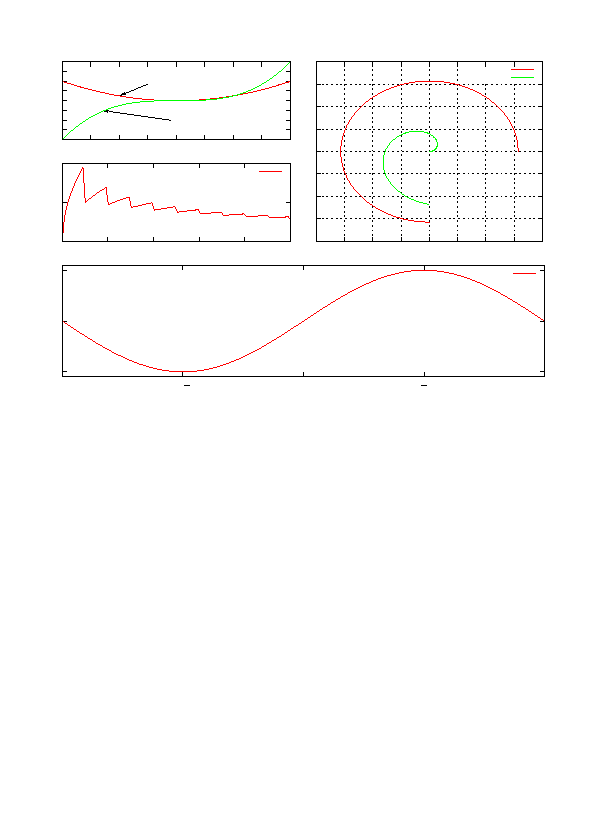
Figure 12: Example of a custom designed multiplot.
The code for figure
# Set canvas size with: size <x> <y> in cm when "metric" is given.
# "inches" changes to inches!
set terminal fig color size 18 12 metric textspecial
set output "plot/multiplot2.fig"
set multiplot
# Set left margin to 3 character’s width:
set lmargin 3
### Lower plot
# First, define size and where to plot the sine:
set size 1,0.4
set origin 0,0
# Set nice xtics:
set xtics ("$-\\pi$" -pi, "$-\\frac{\\pi}{2}$" -pi/2, "0" 0, \
"$\\frac{\\pi}{2}$" pi/2, "$\\pi$" pi)
set ytics -1, 1
plot [-pi:pi] [-1.1:1.1] sin(x)
# Set x- and ytics to default:
set xtics autofreq
set ytics autofreq
### Upper right plot
# Move to another location and set another size:
14