Housner Model Error
0.5%
0.6%
0.7%
0
5
10
15
20
25
30
Error
Water depth [m]
0.4%
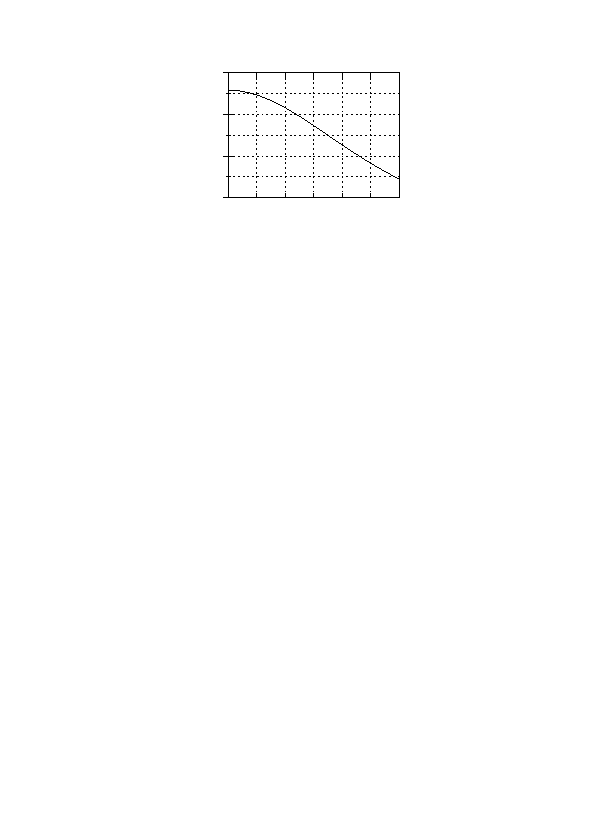
Figure 9: Difference between Housner Model and Fluid Dynamic Model as a function of water
depth in tank.
Boring plot (I mean, compared to the other), but the %-sign was a bit tricky until solution
was found. Anyway, here is the code for figure
set terminal fig size 8 6 metric monochrome textspecial
set output "plot/housner.fig"
# Remove legend:
unset key
# We want a grid for both major and minor ytics and (major) xtics:
set grid ytics mytics xtics
# Set plot range for x and y:
set xrange [0:30]
set yrange [1.004:1.007]
# %-sign in tics must be doubled, like %% to prevent being treated
# by printf as a format changer. See more: gnuplot> help set format. Of course
# double backslashes are needed \\ so it will be transformed into \%
# in the TeX-file. Minor tics, here unlabeled, with an 1 after position.
set ytics axis ("0.7\\%%" 1.007, "" 1.0065 1, "0.6\\%%" 1.006, \
"" 1.0055 1, "0.5\\%%" 1.005, "" 1.0045 1, "0.4\\%%" 1.004)
set title "Housner Model Error"
set xlabel "Water depth [m]"
set ylabel "Error"
plot "data/housner.dat" with lines
11