set output "plot/integral.fig"
x2 = 5
y1 = -0.5
y2 = 1.5
# Set range to display:
set xrange [x1:x2]
set yrange [y1:y2]
set zeroaxis lt 1 lw 2
# Arrows from origin to somewhere, with filled head and 1.5 char length, 20 deg
set arrow to x2,0 head size character 1.5,20 filled
set arrow to 0,y2 head size character 1.5,20 filled
# Labels at arrows head, offset 1 character length:
set label "$y$" at 0,y2 offset character 1
set label "$x$" at x2,0 offset 0, character 1
unset border
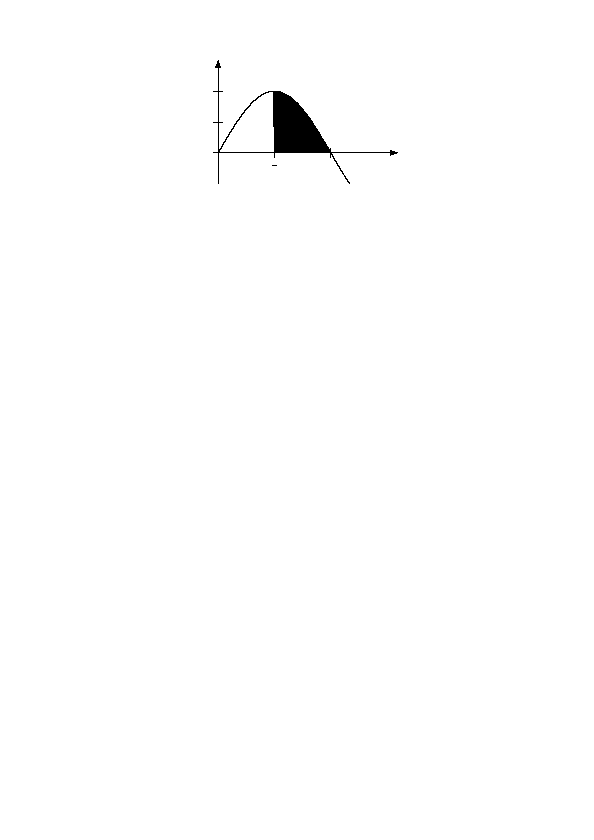
set xtics axis ("$\\frac{\\pi}{2}$" pi/2, "$\\pi$" pi)
set ytics axis 0,0.5,1
plot "data/integral.dat" using 1:2:3 with filledcurves, \
"data/integral.dat" using 1:2 with lines 1